websiteBench - A website performance monitoring tool
Table of Contents
As most of you know, I am a bit obsessed with collecting data in my InfluxDB, so that I can visualize it in Chronograf or Grafana - an I am already collecting lots of data… But one thing that I was missing was a way to easily measure the performance of a website and visualize it accordingly (without having to pay lots of gold nuggets for tools like Pingdom).
Recently, I had to troubleshoot a performance bottleneck on a website. For such cases, I always have my trusty cURL one-liner handy:
curl -sS -w "Connect: %{time_connect} sec. / TTFB: %{time_starttransfer} sec. / Total time: %{time_total} sec. / Size: %{size_download} bytes / Speed: %{speed_download} bps\n" -o /dev/null https://some/url
which quickly provides me with important metrics like the connection time, the time to first byte, speed, etc. In this case the results weren’t really helping as the bottleneck seems not to be visible in simple requests.
So I gave PhantomJS a go. As it is a headless browser, it also interprets the content of the webpage (things like JavaScript, CSS or images). This was indeed helpful but I couldn’t get it to work in a way that I wanted it to work. It gave me an indication of the problem, but I needed more metrics to pinpoint the issue. So eventually PhantomJS basically wasn’t flexible enough and given that the project is not maintained anymore, I searched for an alternative.
Puppeteer to the rescue #
After some research on the interwebs, I came in touch with Puppeteer, Google’s programmable headless browser implementation and boy, is it capable. I quickly put together a simple NodeJS script that browsed the webpage with all it’s resources, collected the metrics of them and provided me with an easy CSV formated output. Pretty impressive I thought and it indeed helped to identify the main bottleneck on that website, which later then could be fixed.
“That’s some impressive shit” I thought to myself and wondered if I could use the script for some more generic purpose - maybe I could finally collect general performance metrics of a website and store it in a more accesible way?
Introducing websiteBench #
Well, of course the first thing that came to my mind was InfluxDB. It’s a time-series database, so it’s basically perfect for collecting lots of different (performance) metrics over time and then run reports on it and/or visualize the data. I decided to build some tool that uses Puppeteer to browse a website, collect the performance metrics and stores it in an InfluxDB - and as Puppeteer is NodeJS based, it was an easy decision to use TypeScript as the script language for this purpose. And because I am always good in coming up with creative names, the tool should from now on be called “websiteBench”.
I wanted to build the tool as multi-purpose as possible and I wanted to make use of NodeJS’ event-driven architecture. It’s featureset should be similar to commercially available tools like Pingdom but it should be built on standard tools like InfluxDB and Chronograf, so I don’t have to build some GUI around it. Also I decided to make it OSS and to build it in a way, that it is easily depoloyable. So, I developed it with the idea in my head, that it should be runable in a Docker container without much efforts.
A public Github repository was quickly set up as well as the corresponding Dockerhub repo. Thanks to NodeJS and it’s events, it was easy to build it in a way, so that one can confiugre different websites with an URL, a title and a checking interval. This way you can have website A be checked every 60 seconds, while website B might only be checked every 180 seconds. It took only an evening of development, until I had my first prototye running. I could see default connection metrics like “connect time”, “dns time”, “ttfb” in my InfluxDB and build fancy graphs with Chronograf. But in addition I had interesting metrics like “how long took the DOM to load/execute”. Awesome!
Development conditions often don’t match real-life #
After some nights of development, I had websiteBench at a state, which I considered as “1.0” release ready. So I started up a Hetzner Cloud VM, installed Docker and wanted to run some “real-life” tests. I also wanted to store the data in a public InfluxDB Cloud instance, so I could show it to people… well, quickly did I realize that I couldn’t do either.
For one, InfluxDB Cloud is Flux 2.0 based and uses a token-based authentication mechanism, while websiteBench was using the InfluxDB 1.7-based username/password authentication. Also my Hetzner Cloud VM, was the smallest one they offer, so it had only one CPU and 2GB of RAM - and everybody knows Chrome is a beast of a RAM eater. So, quickly my VM was running out of memory, which caused inconsistent metric collection.
So back to VSCode to implement some fixes for that. I mean, there is not much I can do in terms of Chrome’s memory requirements, but I could at least optimize where it was possible. I tweaked some stuff, added an automated “killswitch” , so that Chrome is killed after some time to free some memory and restarts a clean instance. I also implemented the Flux 2.0 authentication scheme.
All worked fine. But I still wasn’t happy with the memory consumption on the VM. So I decided to implement cURL support. Yes, cURL does not offer all the performance metrics, that a real browser like Chrome does (like the DOM i. e.), but it gives all the basic connection metrics, that could already provide some good understand of a websites performance. And of course it’s memory/CPU footprint is just a fraction of that of Chrome.
Test it, enhance it, contribute #
Meanwhile, websiteBench is released in version 2.0.5. A lot of fixing and tweaking has been done over the last month and I am pretty happy with the results. I added stuff like the collection of every single resource that is loaded (in Chrome-mode), status code collection, etc. The Docker version works fine as well. A setup can be done in less that 5 minutes, I’d say.
So if you are looking for some in-depth performance measures of your website(s) and you are already running an InfluxDB instance, why not give it a try? I’d happy to get some feedback. Enhancements, fixes and other PRs on Github are of course always welcome - that’s what OSS is for.
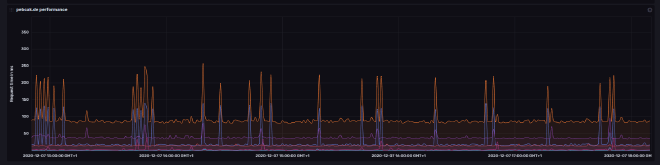
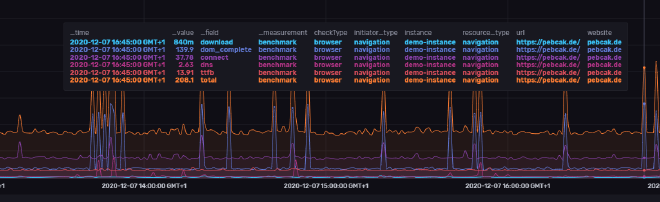
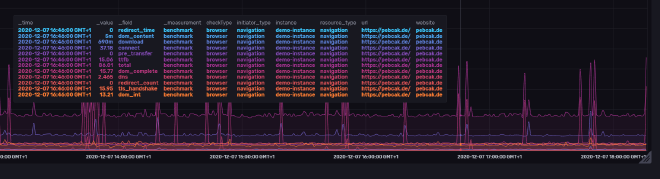
Here are some screenshots of what the visualization can look like. The metrics in this example are collected from this
blog, every 30 seconds. The graphs have been configured to show the mean-time over a 1 minute period.
This data has been recorded in a free InfluxDB cloud instance